SaaS2Cloud is Assurestor's cloud-to-cloud backup for Microsoft 365, Google Workspace and other SaaS platforms, powered by CloudAlly. This guide walks through the SaaS2Cloud pages in My2Cloud - the live Accounts, Tasks and Backup Sets lists, the Billing Forecast, and the analytics dashboard that shows how your usage trends month on month.
Where to find it. In the left menu open Services → SaaS2Cloud for the live pages (web address/app/main/services/saas2cloud/…), and Analytics → SaaS2Cloud for the usage dashboard (/app/main/analytics/saas2cloud/dashboard). Which pages you see depends on the features enabled for your organisation.
A quick note on wording. What CloudAlly calls a "user" is shown as an Account everywhere in My2Cloud. Throughout SaaS2Cloud an "account" means one backed-up mailbox owner, domain or SaaS tenant, not your My2Cloud login.
Finding your way around SaaS2Cloud
Under Services → SaaS2Cloud you will find five pages, plus a link out to the CloudAlly partner portal:
- Dashboard - a real-time overview of accounts, tasks, backup sets and storage.
- Accounts - the live list of every backed-up account.
- Tasks - the individual backup tasks configured across those accounts.
- Backup Sets - each protected data set, with its latest backup result.
- Billing Forecast - the quantities that will be counted at your next renewal.
A separate Analytics → SaaS2Cloud section holds the historical usage dashboard covered at the end of this guide.
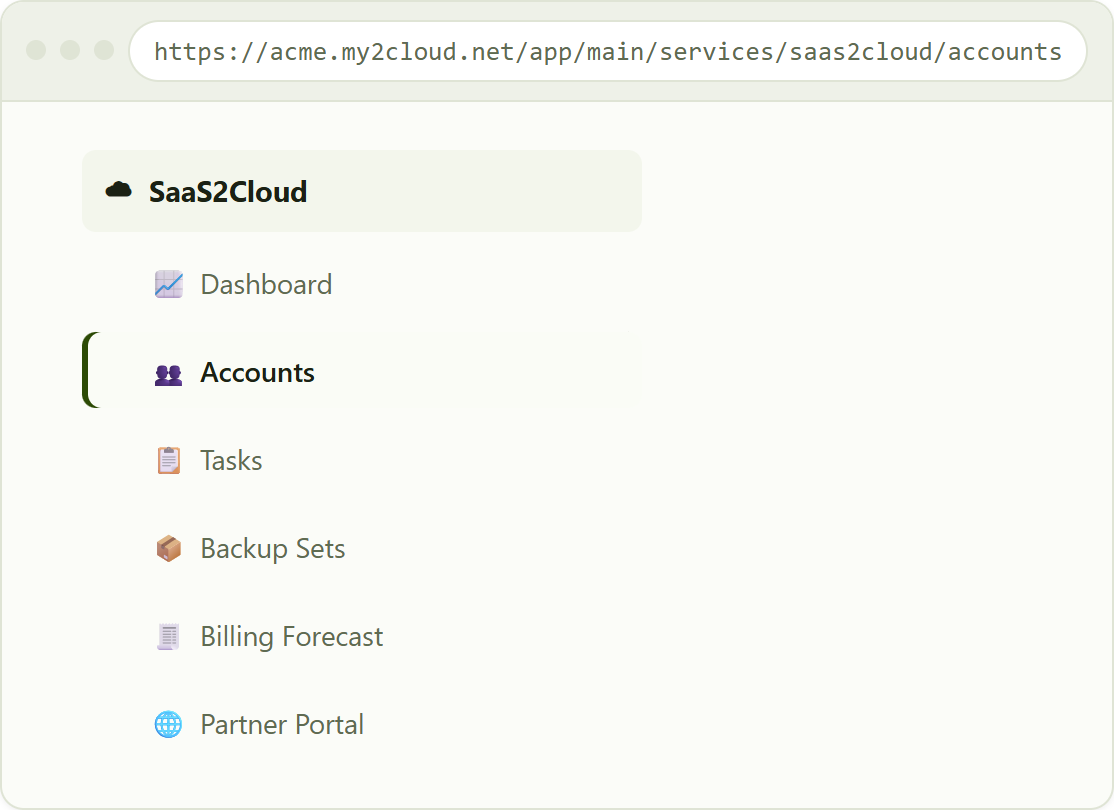
the SaaS2Cloud menu under Services, with Accounts selected.
The Accounts list
The Accounts page is a real-time view of every account we protect for you, pulled straight from CloudAlly. Along the top is the page title, a short description and an Export to Excel button; below it a row of filters, then the table. Click any column header to sort, and the list opens sorted by Account name.
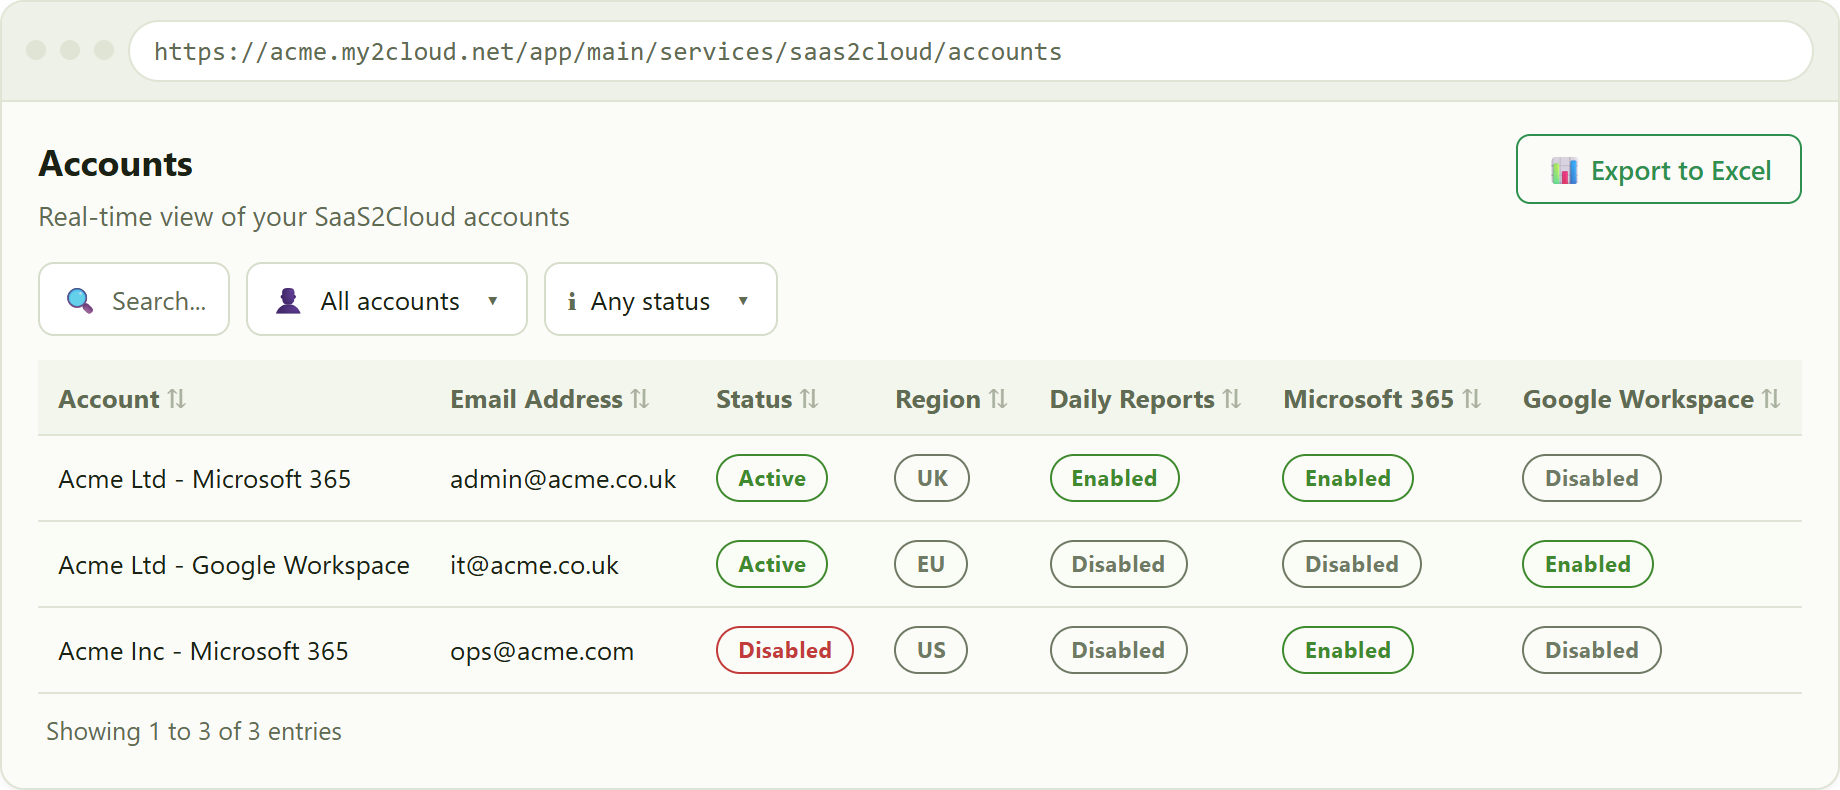
the Accounts list. The Region pill shows where each account's data is held.
What each column means
- Account - the account (CloudAlly user) name.
- Email Address - the primary contact address for that account.
- Status - Active for a live account, or Disabled for one that is no longer backing up.
- Region - a short pill (for example UK, EU or US) showing the storage region where the account's backups are held. Hover it to see the full region code.
- Daily Reports - whether CloudAlly's daily backup report is switched on for the account.
- Microsoft 365 and Google Workspace - whether each enterprise plan is enabled for the account, shown as Enabled or Disabled.
Filtering and searching
The filter row narrows the table instantly, and you can combine the filters:
- Search - free-text match across account name, email, status and region.
- Account - jump straight to a single account. Start typing to find one in a long list.
- Status - choose Any status, Active or Disabled.
Export to Excel downloads the list exactly as you have filtered and sorted it on screen.
The Tasks view
Where an account is the "who", a task is the "what" - each individual backup job configured against an account, such as its mailboxes, its drive, or its sites. The Tasks page lists them all across your accounts and opens sorted by Next Backup.
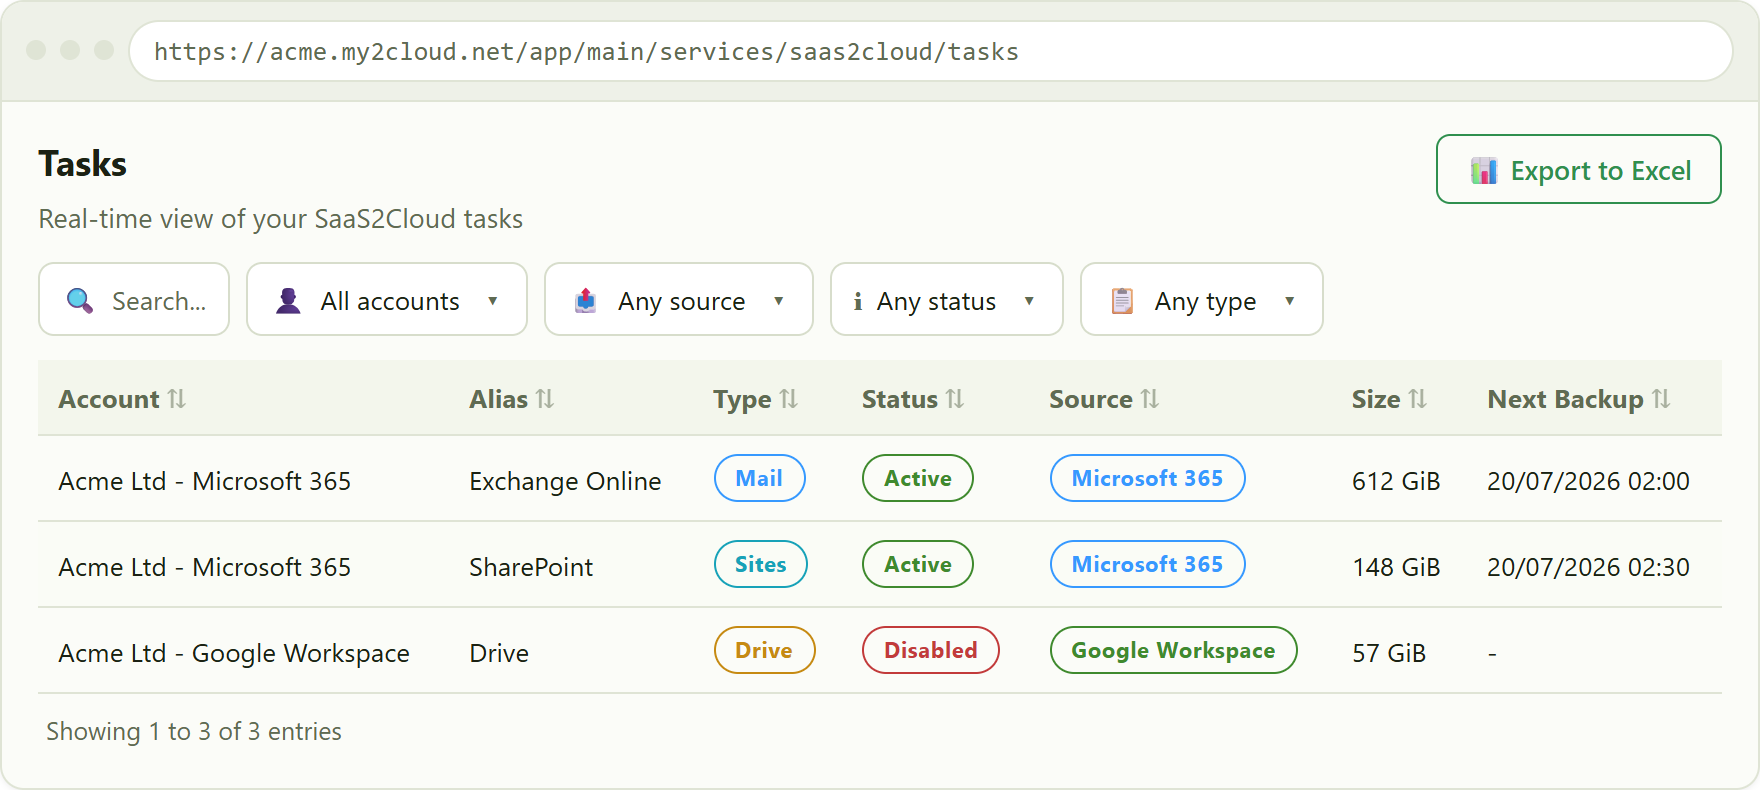
the Tasks list, filtered by account, source, status and type.
The columns are Account, Alias (the task's name), Type, Status, Source (the platform, such as Microsoft 365 or Google Workspace), Size and Next Backup. Four dropdowns let you filter by account, source, status and type, alongside the free-text search. The status dropdown covers the full set of CloudAlly states - Active, Not Active, Failed, Paused, In Progress, Archived and On Premise.
The Backup Sets view
The Backup Sets page shows each protected data set and the result of its most recent backup. It opens sorted by Last Backup Attempt Date, newest first, so anything that has run recently is at the top. The same search and the account, source and status filters apply here too.
Columns are Name, Source, Status, Backup Size, Last Backup Attempt Date and Backup Duration. A set that has not yet run shows Never previously run in place of a date. Click the arrow at the start of any row to expand it and see the per-source Backup Status breakdown, including the sub-source and any error reported against it - handy for pinpointing exactly which mailbox or site in a task had a problem.
The Billing Forecast
The Billing Forecast is a per-account view of the quantities that will be counted at your next renewal, so there are no surprises when the invoice arrives. Its subtitle makes the intent clear: "SaaS2Cloud next payment forecast by account". The forecast is an estimate and the final invoice quantities may vary.
Quantities only, never prices. This page shows how much is protected - mailboxes and storage - so you can check the counts. It does not show any pricing. For costs, refer to your invoice or contract.
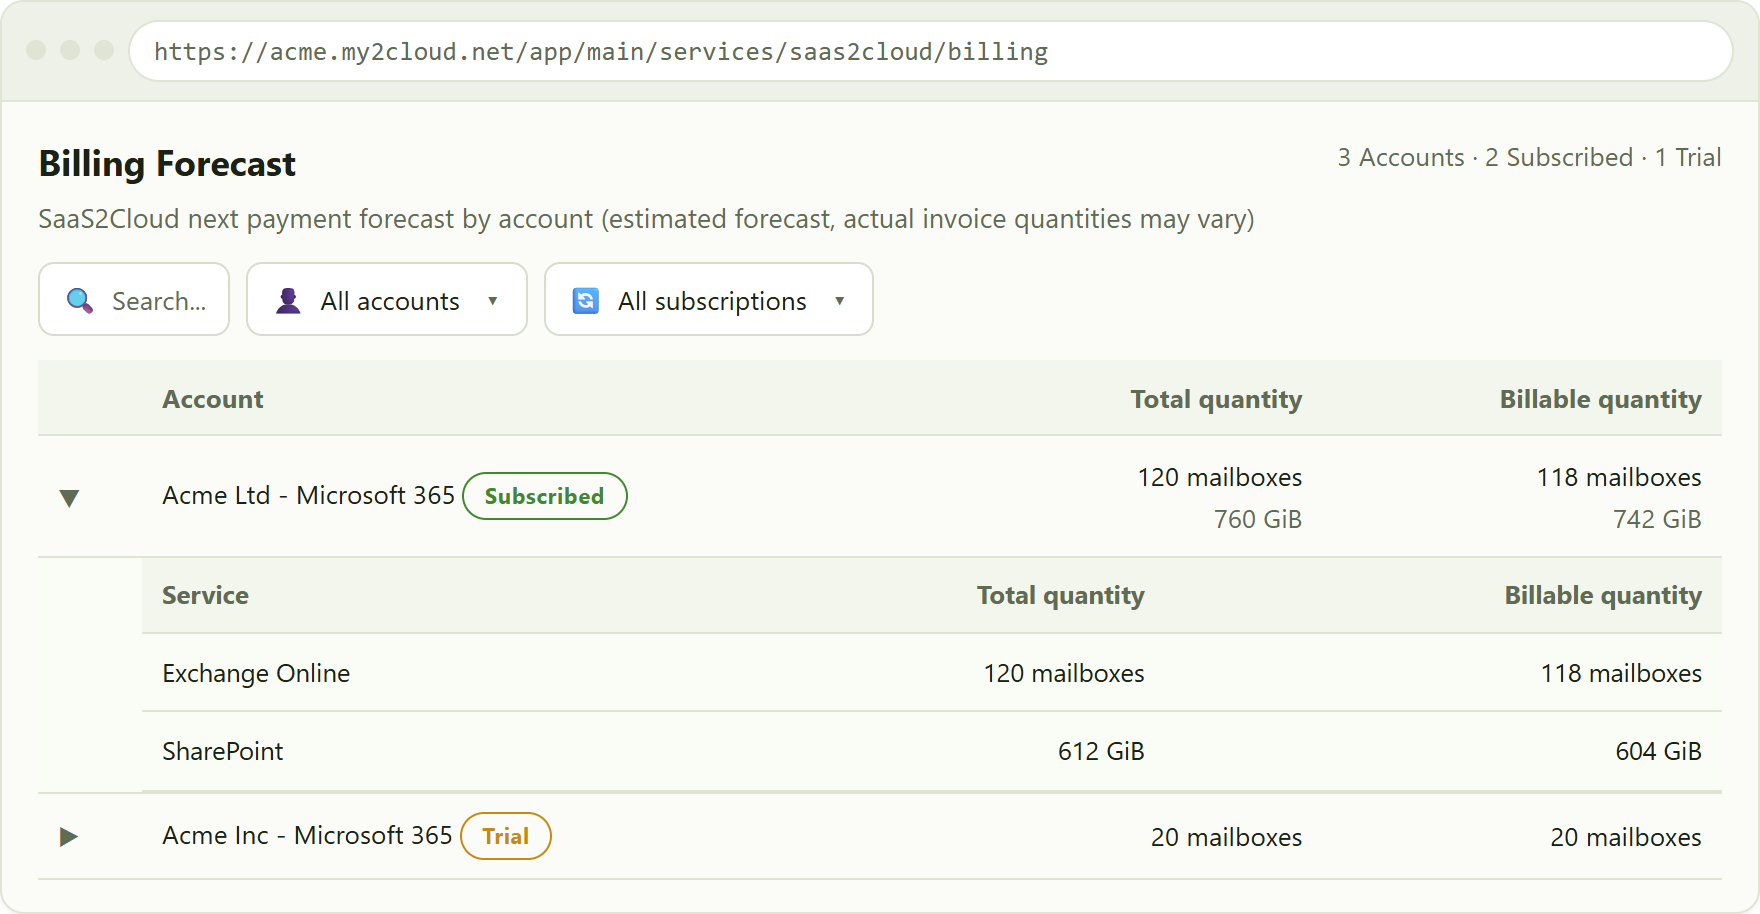
the Billing Forecast. Expand a row to see the quantity per service. No prices are shown anywhere.
Each row shows the account, a Subscribed or Trial pill (hover it for the next renewal date), and two figures: Total quantity and Billable quantity. Quantities are given as a number of mailboxes and, where relevant, a storage size. The count strip in the header summarises how many accounts are subscribed versus on trial. Expand a row with the arrow to break the forecast down per service.
Usage over time - the analytics dashboard
The live pages tell you where things stand right now. To see how your protection is growing, open Analytics → SaaS2Cloud → Dashboard. It draws on up to twelve months of collected history and leads with a row of stat tiles, each showing a peak value and how it has moved against the previous month.
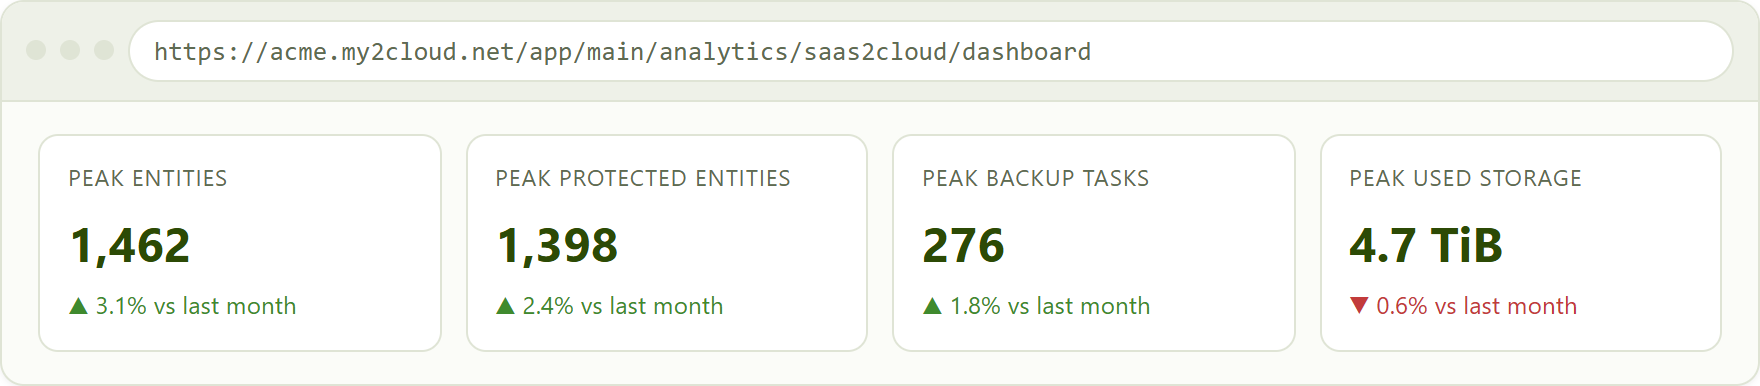
the SaaS2Cloud analytics stat tiles, each with a month-on-month delta.
The tiles cover the numbers that matter for growth planning:
- Peak Entities - the highest number of accounts and mailboxes discovered in the month.
- Peak Protected Entities - how many of those were actively protected.
- Peak Backup Tasks - the busiest count of backup tasks running.
- Peak Used Storage - the most storage your backups occupied.
The small coloured pill on each tile is the month-on-month change: ▲ up in green when the figure has grown, ▼ down in red when it has fallen, and a grey dash when there is no earlier month to compare against. Below the tiles the dashboard carries trend charts - Cloud Entities, Backup Tasks and Backup Storage - plotting the same measures across the months, along with a Billing Forecast panel and a Backup Sets table. As with all My2Cloud dashboards you can rearrange, add or remove these widgets to suit how you like to read the data.
Tips
- Use the Status filter on the Accounts page set to Disabled to find accounts that have stopped backing up.
- Sort Backup Sets by Last Backup Attempt Date (oldest first) to spot anything that has not run recently, and expand a row to see which source failed.
- Check the Billing Forecast before a renewal to confirm the mailbox and storage counts look right - remember it shows quantities only, never prices.
- Watch the Peak Used Storage tile and the storage trend chart month on month to anticipate how your usage is heading.
- Export to Excel is available on the live lists and always reflects your current filters and sort order.
Was this article helpful?
That’s Great!
Thank you for your feedback
Sorry! We couldn't be helpful
Thank you for your feedback
Feedback sent
We appreciate your effort and will try to fix the article