The Billing Forecast is a new feature in My2Cloud 3.1. It gives you a clear, account-by-account view of exactly what your next SaaS2Cloud payment will cover - the number of mailboxes we are protecting and the storage those backups hold - so a renewal never takes you by surprise. It shows quantities only, never prices. This guide covers the live forecast page and the matching analytics view in detail.
Where to find it. In the left menu open Services → SaaS2Cloud → Billing Forecast (web address/app/main/services/saas2cloud/billing). The historical version lives on the Analytics → SaaS2Cloud → Dashboard as the Billing Forecast panel (/app/main/analytics/saas2cloud/dashboard).
Quantities only, never prices. The Billing Forecast never shows any pricing, rates or amounts - anywhere. It shows how much we protect for you (mailboxes and storage), so you can sense-check the counts that will be billed. For actual costs, always refer to your invoice or your contract.
Who can see it
The Billing Forecast is switched off by default. It only appears when two things are in place:
- A Billing Forecast feature is enabled for your organisation. This is done centrally by Assurestor.
- Your user account (or the role you belong to) has the Billing Forecast page permission. Your own administrator grants this per user or per role.
Because of this, not everyone in your organisation will see the page - it is common to limit it to finance or account-owner logins. Assurestor host staff always have access. If you expect to see it and do not, ask your administrator to enable the permission for you.
What the forecast shows
The page answers one question: if we invoiced today, what quantities would appear on it, and against which accounts? The title reads Billing Forecast, with the subtitle "SaaS2Cloud next payment forecast by account (estimated forecast actual invoice quantities may vary)." That wording is deliberate - it is a forecast built from live figures, and the final invoiced quantities can move slightly by the time the bill is raised.
Every backed-up account is listed as its own row. On the right of the header a small count strip summarises the estate: how many Accounts there are, how many are Subscribed, and how many are on Trial. Each row can be expanded to show the individual services that make up its figures.
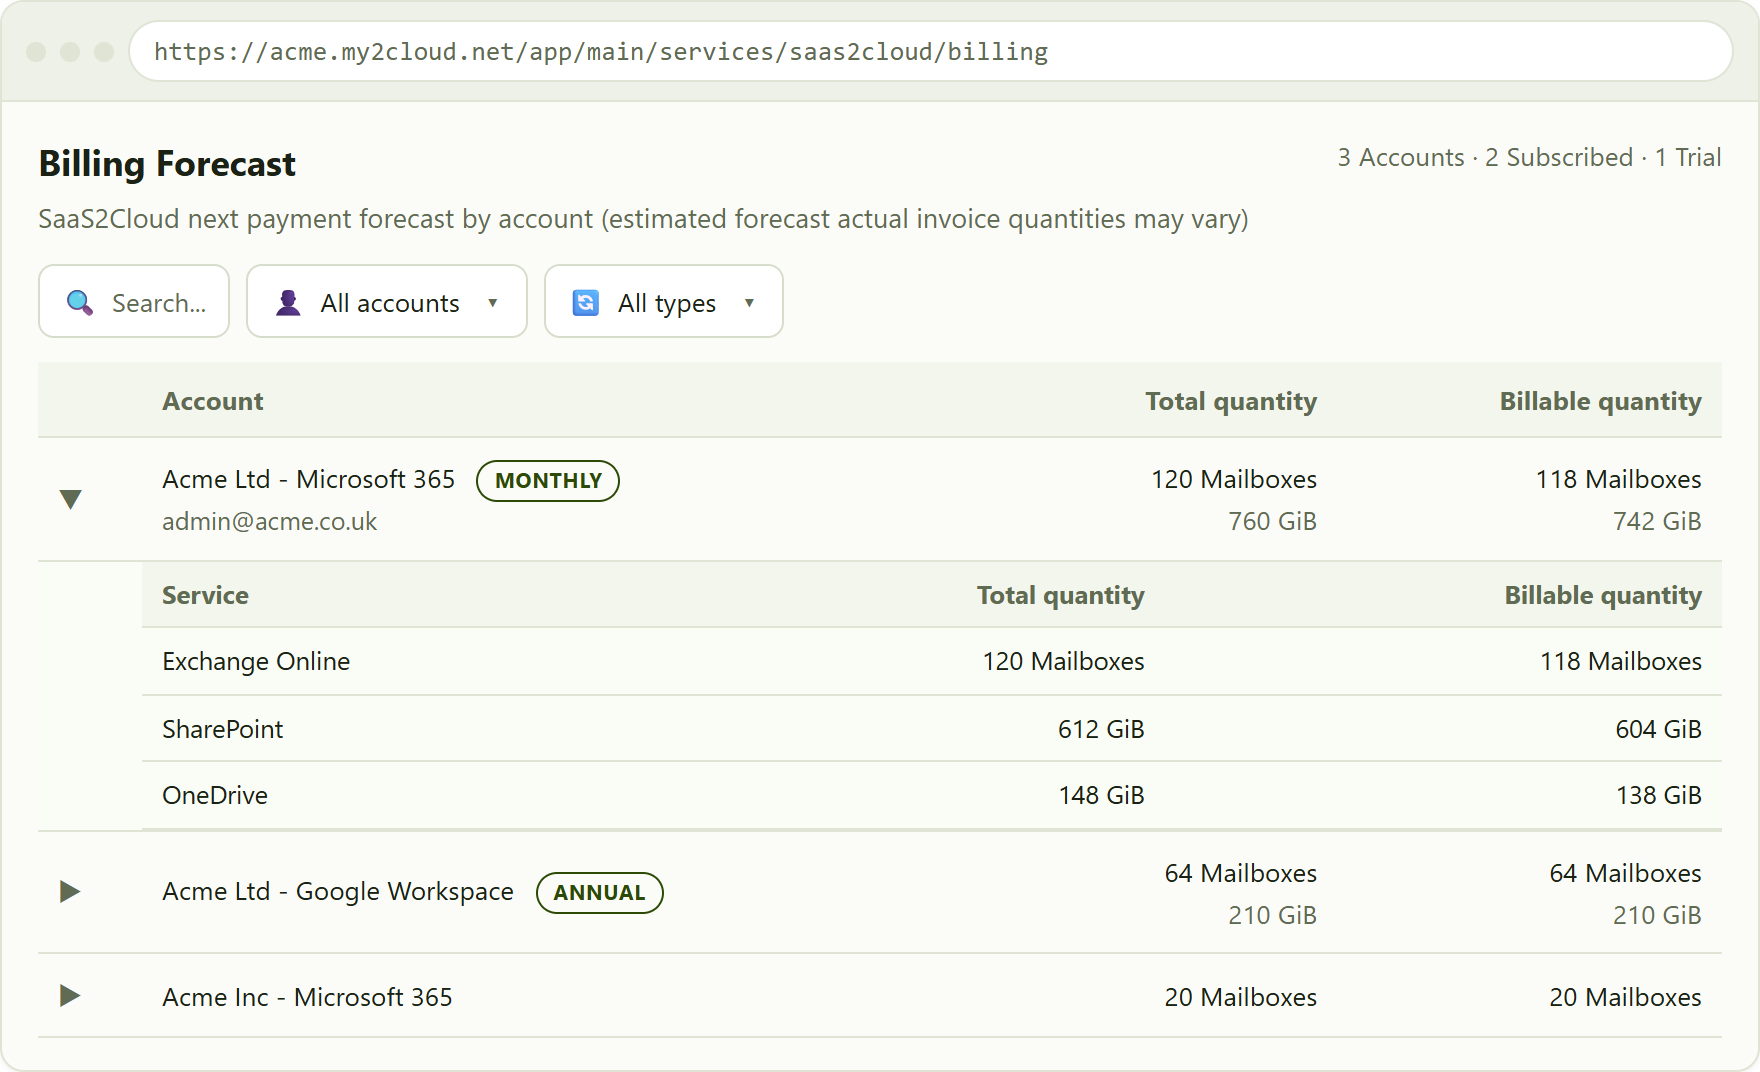
the Billing Forecast, grouped by account with one row expanded to show the per-service breakdown. Sample data only - no prices appear anywhere.
Total quantity vs Billable quantity
Every row, and every service line inside it, carries two figures side by side:
- Total quantity - everything we have discovered and are protecting for that account or service, whether or not it is charged.
- Billable quantity - the portion that will actually be counted on the next bill. This is the number that feeds your renewal.
The two are often the same, but they can differ. A mailbox that is protected but not counted (for example a shared or resource mailbox that is not chargeable) is included in Total but left out of Billable. Seeing both together lets you check, at a glance, that the billable count matches what you expect to pay for.
The two things that drive the forecast
Whatever the service, the forecast comes down to two measures:
- Billable mailboxes - the count of protected accounts. This is the same "accounts" figure you see across the rest of SaaS2Cloud, shown here as a number of Mailboxes.
- Storage - the protected size held for services that are measured by capacity rather than by mailbox, shown as a binary size (for example GiB or TiB).
Each service line reports whichever of these applies to it. Mailbox-based services (such as Exchange Online) show a mailbox count; capacity-based services (such as SharePoint or OneDrive) show a storage size. An account's headline Total and Billable figures are simply its service lines added up, so a single account can show both a mailbox count and a storage size on the same row.
Reading an account row
Each row shows:
- The Account name, with the account's email address beneath it where the two differ.
- A small Monthly or Annual pill next to the name, showing that account's subscription type. Hover the pill to see its Next Renewal Date - the date the forecast is building towards. An account with no set subscription type simply shows no pill.
- The Total quantity and Billable quantity for the account as a whole.
Click the arrow at the start of a row to expand it. The expanded panel is a small Service / Total quantity / Billable quantity table breaking the account down line by line, so you can see exactly which service contributes each mailbox or gigabyte. Only one row stays open at a time - opening another closes the last.
Filtering the list
Three controls sit above the table and narrow it instantly. Combine them freely.
- Search - free-text match across the account name and email address.
- Account - jump straight to a single account. The list is searchable, so start typing to find one quickly in a long estate. The default is All accounts.
- Subscription type - choose All types, Monthly or Annual to see only accounts renewing on that cycle. This is handy when you want to reconcile just the accounts due on a monthly run, or just the annual ones.
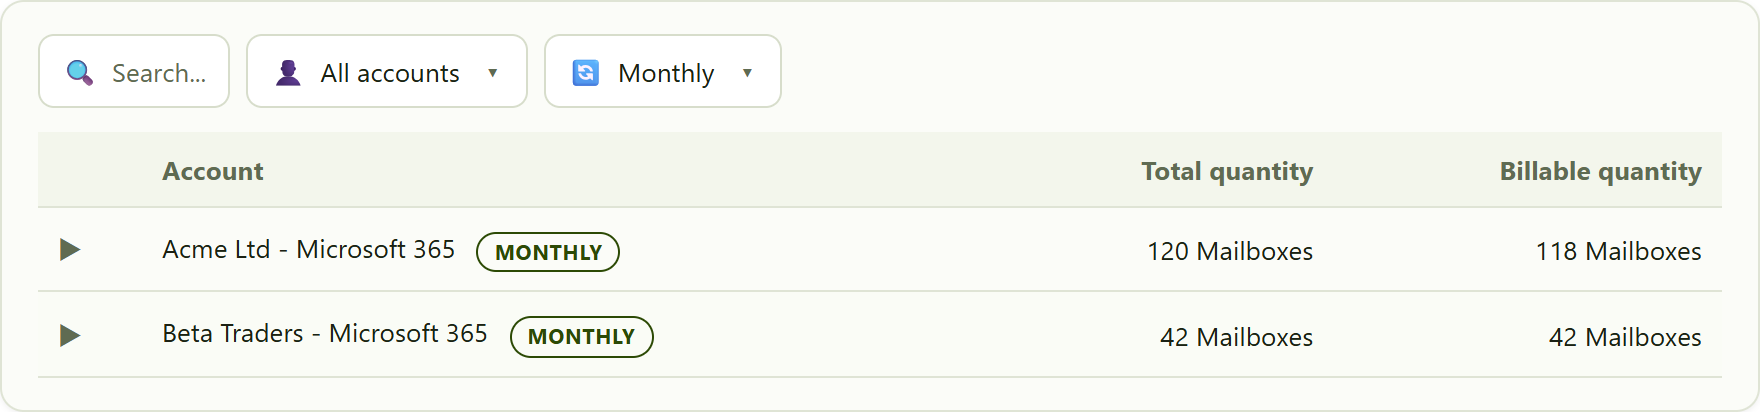
the Subscription type filter set to Monthly, listing only accounts on a monthly renewal.
Peak quantities over time - the analytics view
The live page shows where things stand right now. To see the forecast against your collected history, open Analytics → SaaS2Cloud → Dashboard and look at the Billing Forecast panel. It reads the same way - grouped by account, expandable to a per-service breakdown, with Total quantity and Billable quantity columns - but with one important difference.
Instead of the current figures, the analytics panel shows the peak each quantity reached across the date range you have selected on the dashboard. In other words, it reports the busiest point in the period - the most mailboxes and the most storage that were counted as billable at any snapshot in that window. That makes it useful for spotting the true high-water mark before a renewal, rather than just today's number. Changing the dashboard date range, or the SaaS2Cloud account filter, updates the panel to match.
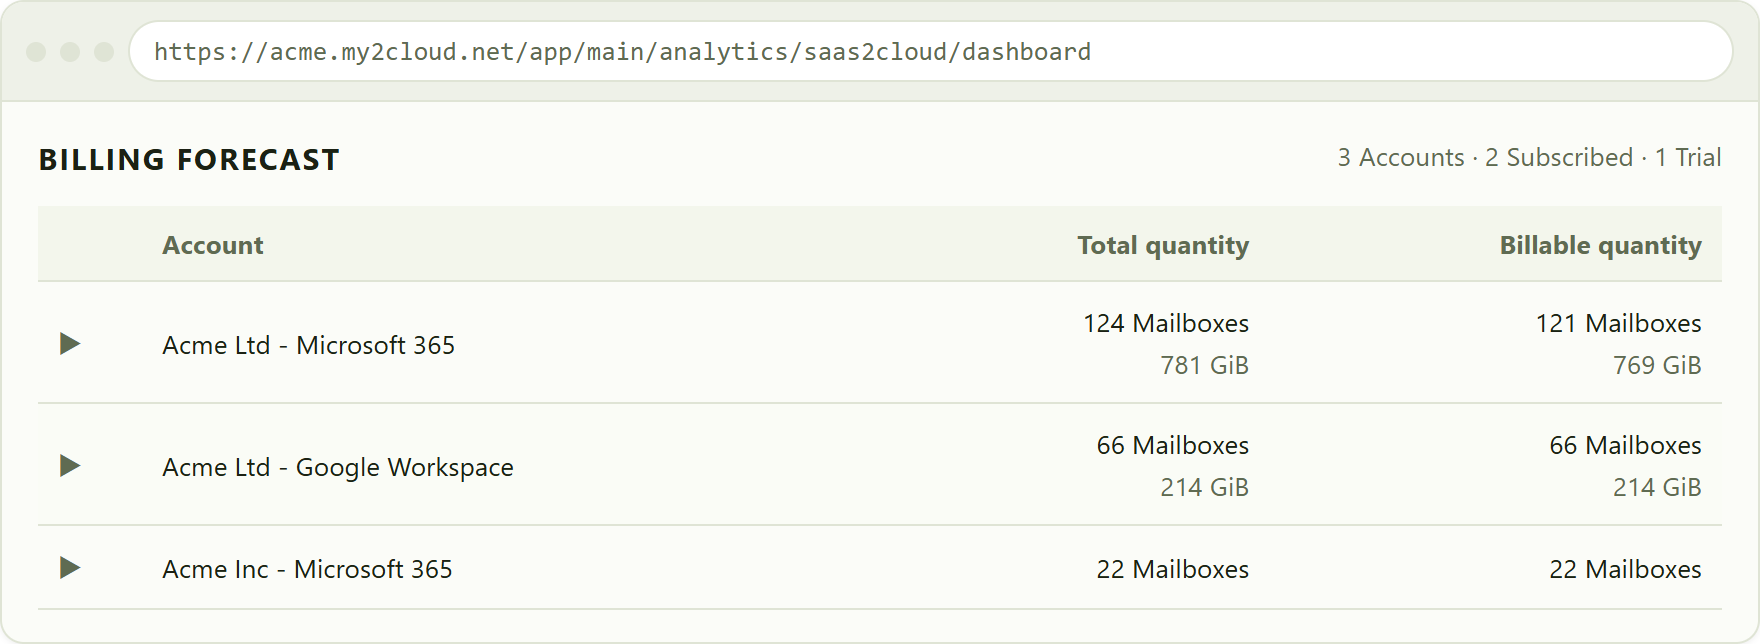
the analytics Billing Forecast panel, showing the peak billable quantities reached over the selected date range.
Tips
- Check the live Billing Forecast a few days before a renewal and confirm the Billable quantity looks right for each account.
- Where Total and Billable differ, expand the row to see which service accounts for the gap.
- Use the Subscription type filter to reconcile monthly and annual renewals separately.
- Hover an account's Monthly or Annual pill to read its next renewal date without leaving the page.
- For planning, compare the live figure with the analytics peak over the last month or quarter to see whether your usage is trending up.
- Remember throughout: these are quantities, not costs. No pricing is shown here - your invoice remains the source of truth for what you pay.
Was this article helpful?
That’s Great!
Thank you for your feedback
Sorry! We couldn't be helpful
Thank you for your feedback
Feedback sent
We appreciate your effort and will try to fix the article