Veeam2Cloud gives you a set of live views into everything we protect for you with Veeam. This guide walks through the main ones - the Protected Data Overview, the Protected Data, Backup Jobs and Active Alarms lists, your Cloud Connect usage, and the VBR Licensing view - and explains how virtual machines and cloud instances are counted and sized.
Where to find it. In the left menu open Services → Veeam2Cloud. You will see Dashboard, Companies, Backup Resources, Active Alarms, Backup Jobs and Protected Data. The web addresses all begin /app/main/services/veeam2cloud/. Every view shows live data collected from Veeam.
The Veeam2Cloud views at a glance
Your Veeam2Cloud area is made up of one dashboard and a handful of detailed list pages:
- Dashboard - a customisable summary built from live cards (widgets), including the Protected Data Overview, Cloud Connect Usage and VBR Licensing cards described below.
- Companies - the customer companies linked to your Veeam2Cloud service.
- Backup Resources - your Cloud Connect repositories and their storage and quota usage.
- Active Alarms - alarms currently raised across your companies.
- Backup Jobs - every backup job and how it last ran.
- Protected Data - a per-machine list of everything protected, with its sizes and safety status.
Each list page has a Search box, filters, and an Export to Excel button that downloads the list exactly as you have it filtered and sorted on screen.
Protected Data Overview
The Protected Data Overview card on your dashboard is the quickest way to see the shape of your protection. It splits your protected workloads into two groups and counts each one in its own right:
- Virtual Machines - the machines you protect on your own site (for example your VMware or Hyper-V servers).
- Cloud Instances - workloads you protect that already live in the public cloud (for example cloud-hosted virtual machines).
For each group the card shows a Quantity (how many workloads) and a Size (the total backup size we hold for them). The centre of the card totals both groups as your overall Workloads figure. Keeping the two groups separate matters because they are protected in different ways, so it is normal for their counts and sizes to look quite different.
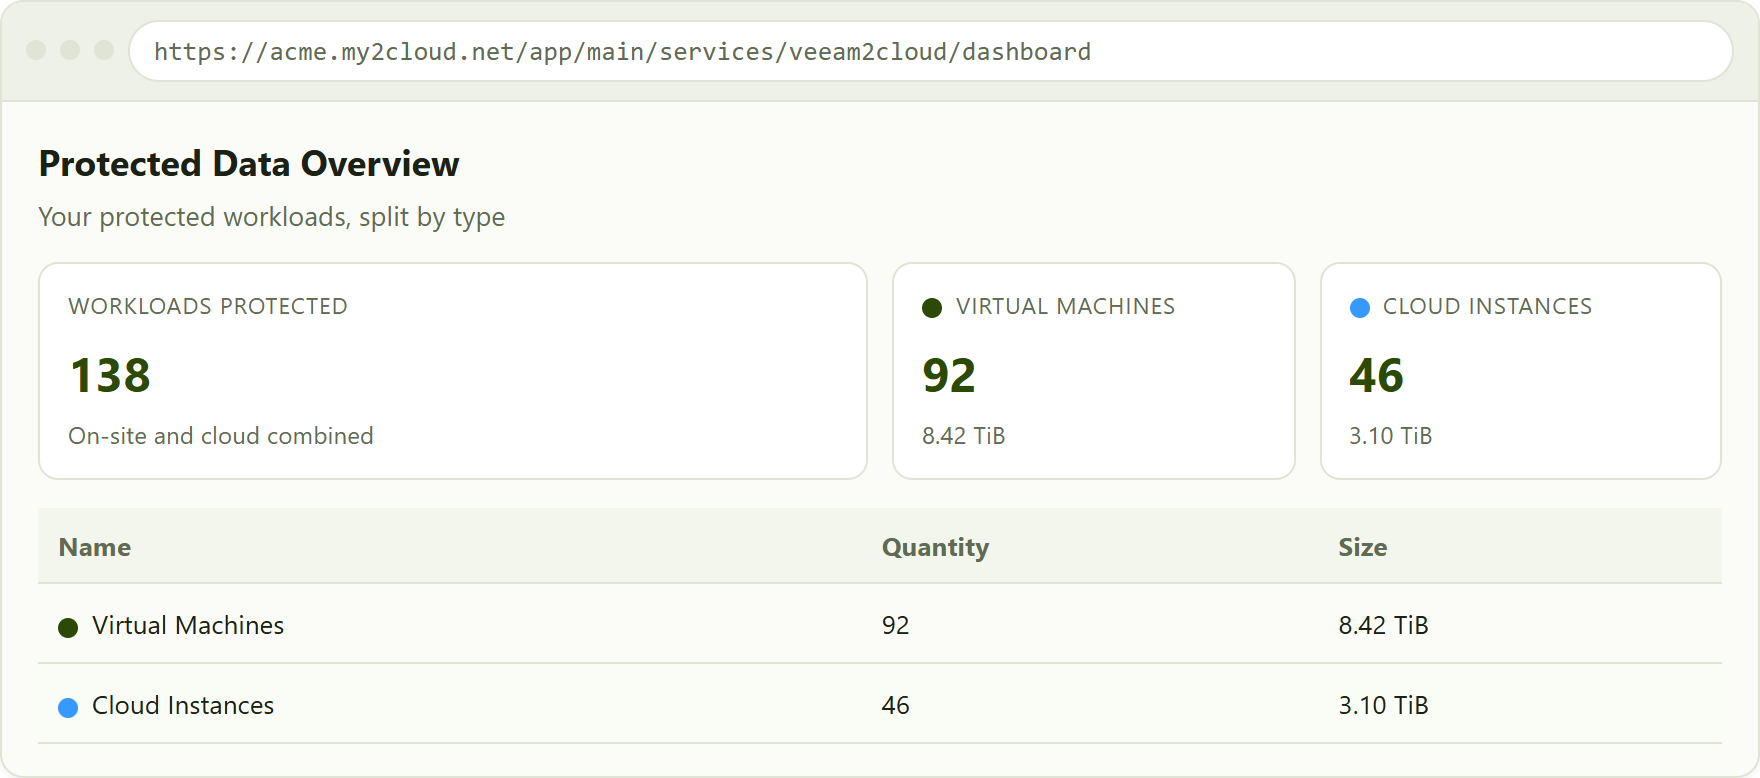
the Protected Data Overview. On-site Virtual Machines and public-cloud Cloud Instances are counted and sized separately, then totalled in the centre.
About sizes. Sizes throughout Veeam2Cloud are shown in binary units (GiB, TiB) and represent the size of the backups we hold, not the raw size of your live environment. The Overview totals the backup size across all of a group's machines.
The Protected Data list
The Protected Data page lists every protected machine individually, so you can check any single workload. Alongside the machine Name, Platform, Backup Server and Company, each row shows:
- Malware State - the result of Veeam's malware scanning, shown as a coloured pill: Clean, Unverified (not yet scanned), or Suspicious / Infected if something was detected.
- Immutability - whether the backups are locked so they cannot be changed or deleted for a set period (Yes or No).
- Cloud Copy - whether a copy of the backup is also kept in the cloud (Yes or No).
- Source Size - the original size of the machine being protected.
- Backups - how many backups exist for the machine. This is a link: click it to open a panel listing each backup, its restore points and where it is stored.
- Last Backup, Backup Size and Backup Target - when the machine was last backed up, the space the backups occupy, and where they are held.
- Backup Copies, Backup Copy Size and Backup Copy Target - the same details for any secondary copy.
Filter the list by Company, Platform, Malware State, Immutability or Cloud Copy to focus on exactly what you need, and click any column heading to sort by it.
Backup Jobs
The Backup Jobs page lists every backup job across your companies and how it last ran. Each row shows the Job name, Company, Server, a colour-coded Job Status, the Type and Platform, when it last ran (Last Run and End Time), the Duration, the Target, the Transferred Data, the Bottleneck and the Schedule.
The status pill tells you the last outcome at a glance: Success, Warning, Failed, or Running while a job is in progress. Jobs whose schedule is Disabled, or that have not run in over a month, are highlighted so they stand out. Use the Company, Type, Job Status, Platform Type and Backup Server filters to narrow the list.
Active Alarms
The Active Alarms page brings together every alarm currently raised across your Veeam2Cloud companies, newest first. Each alarm shows its Status, the Company and Hostname it relates to, the Time it was raised, the Alarm name, the Object affected, and the Number of Repeats.
The Status pill uses a traffic-light scheme so the most urgent items catch your eye: Error for problems needing attention, Warning for things to watch, Info for information, and Resolved for alarms that have cleared. As well as searching and filtering by Company and Status, you can limit the list by Period - All time, Today, Last 7 Days, Last 30 Days, Last 90 Days, or a custom date range.
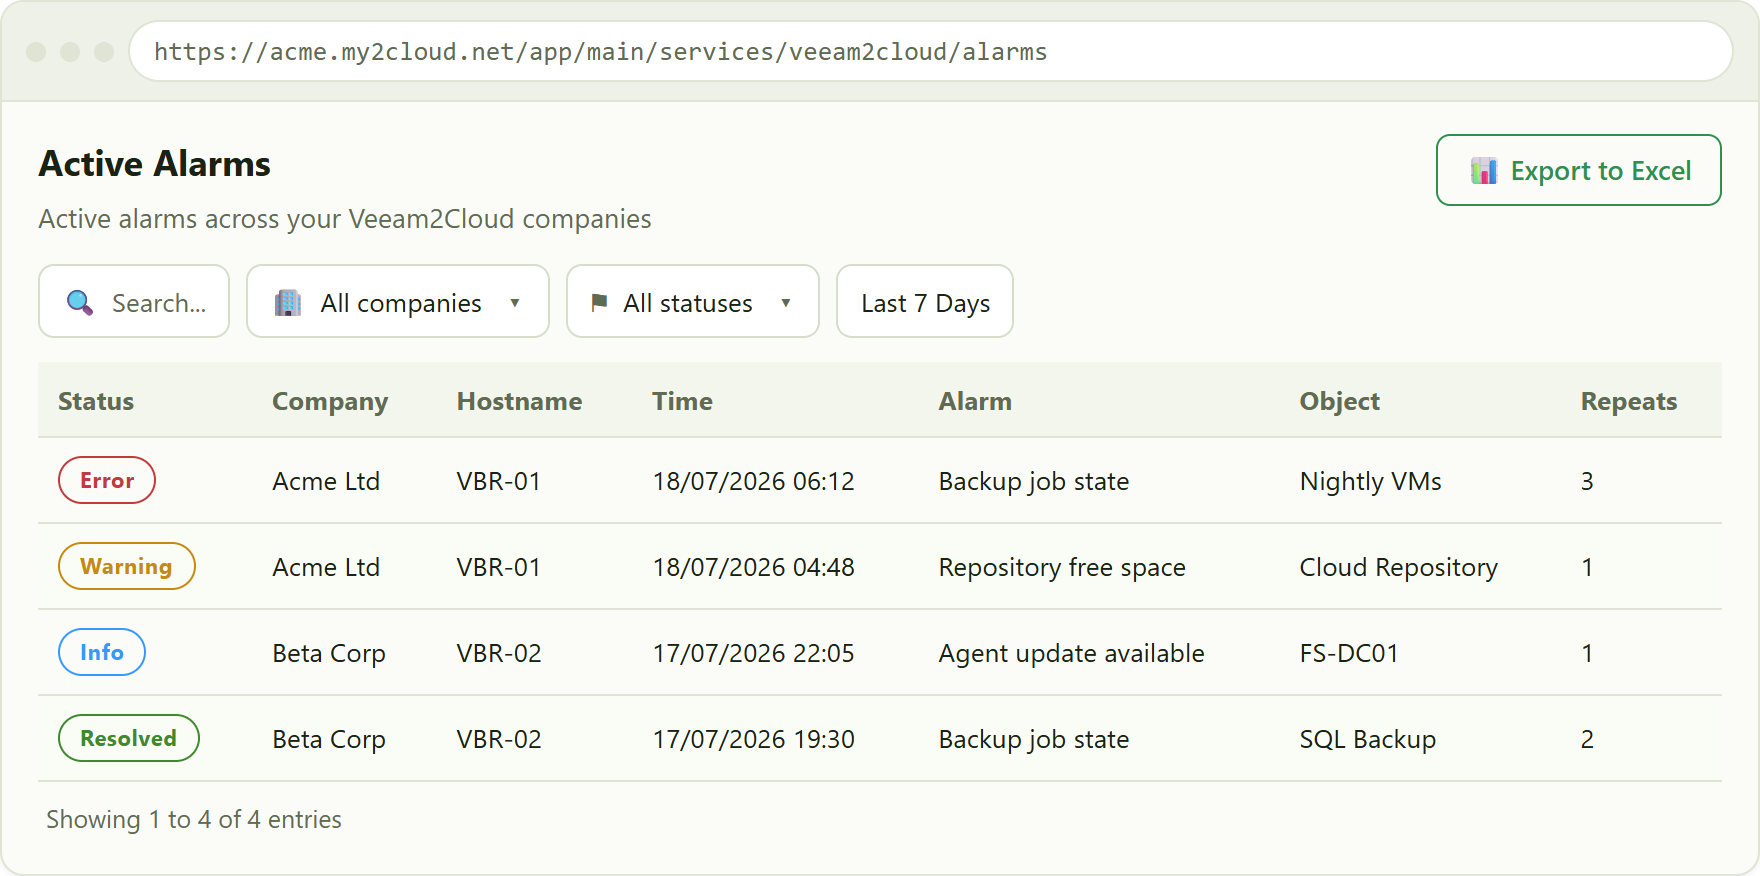
the Active Alarms list. The Status pill colour shows severity, and the Period buttons limit the list to a chosen window of time.
Cloud Connect usage
The Backup Resources page shows how your Cloud Connect storage is being used. Each row is one of your cloud repositories and lists its Company Name, Repository Name, the Storage used against its limit, and your VM Quota, Server Quota and Workstation Quota. A repository with wide-area network acceleration is tagged with a small WAN badge.
The Storage column shows used space against the total as a bar. It turns amber and then red as a repository fills up, so you can spot one approaching its limit before it becomes a problem. A quota shown as Unlimited has no fixed cap.
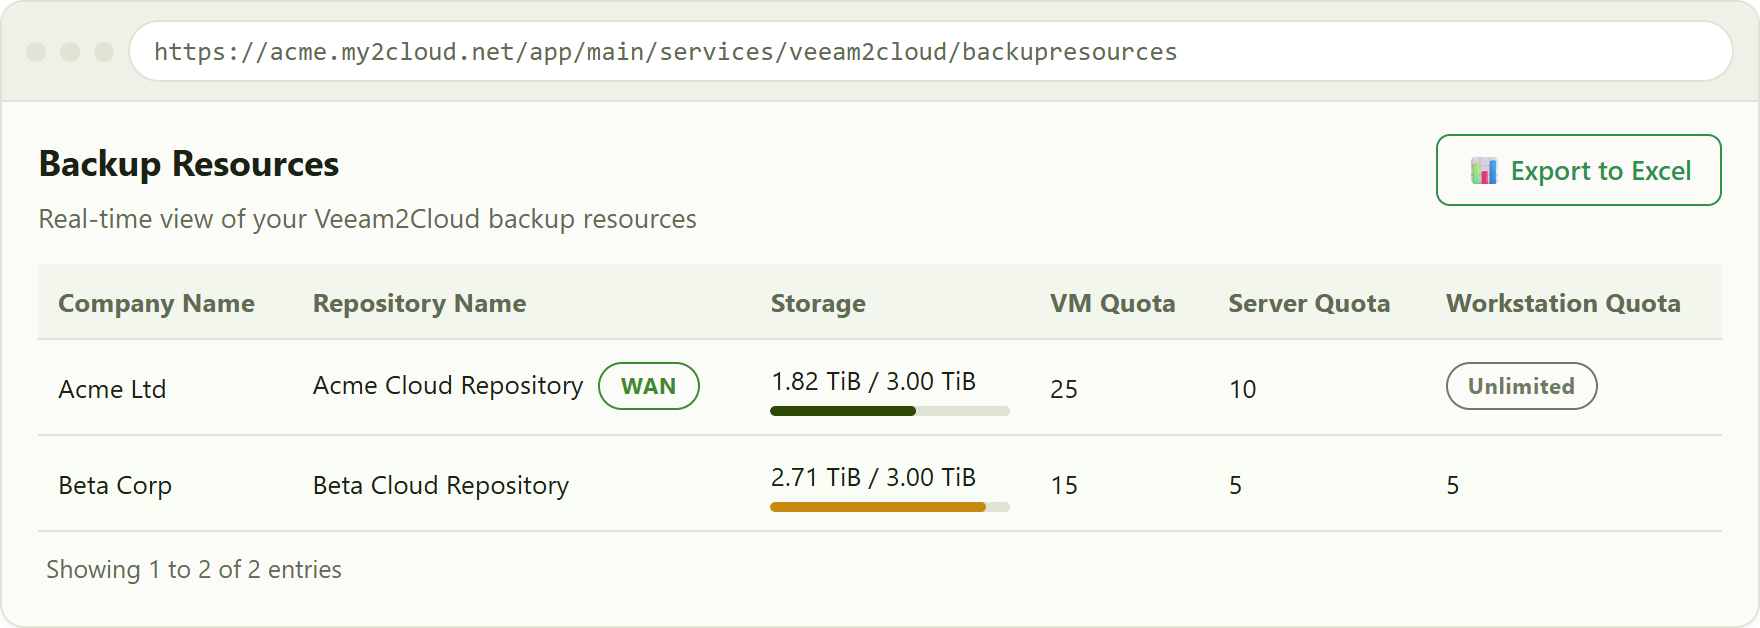
Backup Resources. The Storage bar warns as a repository fills, and quotas can be a number or Unlimited.
Your dashboard also carries a Cloud Connect Usage card that summarises the same storage a different way - the peak cloud storage held for VMs, Servers and Workstations, each with the number protected and how it has moved since the previous month.
The Licensing (VBR Licensing) view
The VBR Licensing card on your dashboard shows how your protected workloads translate into Veeam Backup & Replication licensing. It breaks your workloads into four types - VMs, Cloud Instances, Servers and Workstations - and for each shows the number protected and the licensing points they use.
The important thing to understand here is that Cloud Instances are counted in their own right, separately from VMs. A cloud instance is not folded into your VM figure; it is its own line with its own count and points. This keeps the picture honest, because on-site virtual machines and public-cloud instances are licensed differently.
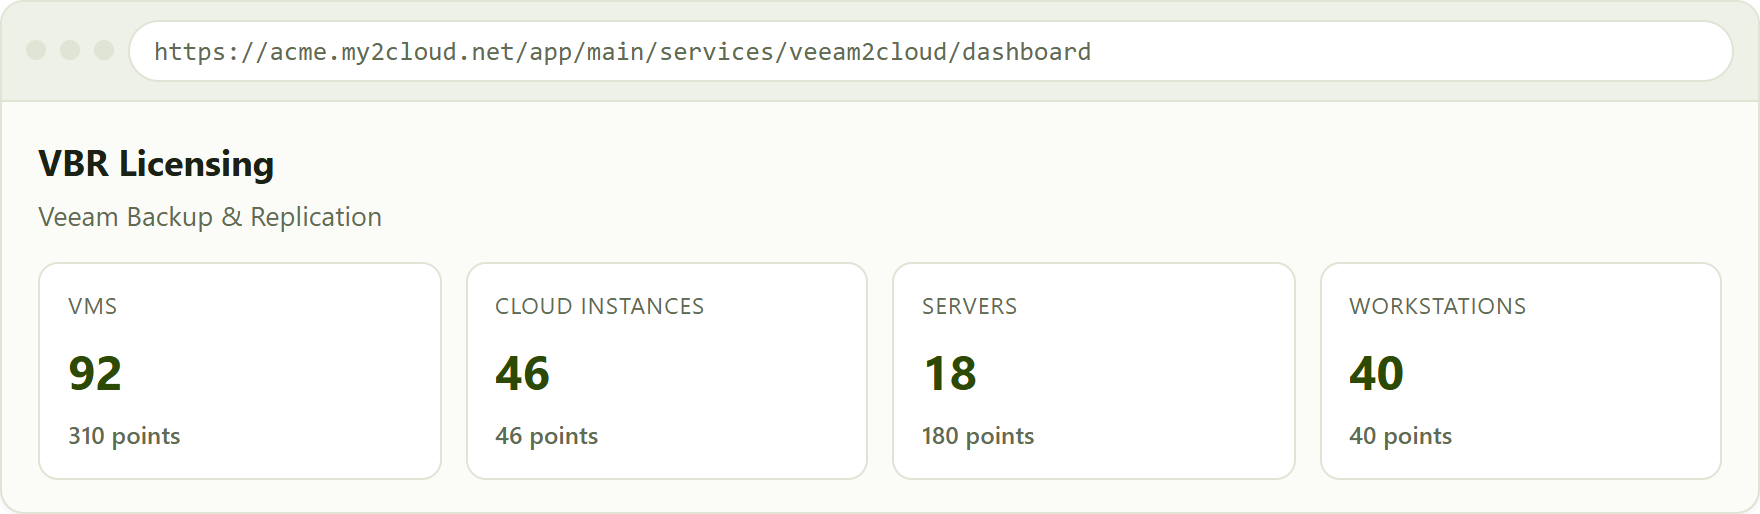
the VBR Licensing card. Each workload type shows its count and the licensing points it uses, with Cloud Instances kept separate from VMs.
For a per-company breakdown, the dashboard's VBR Licensing table lists each company with its Veeam Backup & Replication units (the licensing points) and count (the number protected) for VMs, servers and workstations side by side. Export it to Excel if you need the figures for your own records.
Tips
- Start on the Dashboard for the big picture, then open the matching list page when you need the detail behind a number.
- On Protected Data, filter by Malware State to check nothing is flagged, or by Immutability to confirm your most important machines are locked.
- On Backup Jobs, sort by Last Run (oldest first) or filter Job Status to Failed to find jobs that need attention.
- On Backup Resources, watch for an amber or red Storage bar - that is a repository getting close to its limit.
- Remember that Virtual Machines (on your site) and Cloud Instances (in the public cloud) are always counted separately, both in the Protected Data Overview and in VBR Licensing.
- Any list can be exported with Export to Excel, keeping the filters and sort order you have on screen.
Was this article helpful?
That’s Great!
Thank you for your feedback
Sorry! We couldn't be helpful
Thank you for your feedback
Feedback sent
We appreciate your effort and will try to fix the article