DR2Cloud gives you a live window into your Zerto disaster-recovery replication. This guide walks through the four views you will use most: the VPGs list, the VPG Details pop-up (with RPO and journal history explained in plain terms), the Storage view, and, where it is switched on for your service, the Failover tests view.
Where to find it. In the left menu open Services → DR2Cloud and pick a view, for example VPGs (web address/app/main/services/dr2cloud/vpgs) or Storage (/app/main/services/dr2cloud/storage). Every DR2Cloud view shows live data read straight from Zerto, and each has an Export to Excel button.
A quick note on the words we use
Zerto has a handful of terms that appear throughout these views. In plain English:
- VPG (Virtual Protection Group) - a group of virtual machines that are protected and recovered together as one unit, for example "all the servers behind one application".
- ZORG - the Zerto organisation your VPGs belong to. If you have more than one, you can filter by it.
- Protected site - where your live machines run today. Recovery site - the location we replicate them to, ready to take over.
- RPO (Recovery Point Objective) - how far behind the recovery copy is, in other words how much data you could lose if you failed over right now. Smaller is better.
- Journal history - how far back in time you can rewind and recover to. A longer journal means more checkpoints to choose from.
The VPGs list
The VPGs view lists every Virtual Protection Group in your service, one per row, sorted with the highest RPO first so anything drifting away from its target rises to the top. At the top are a search box, a ZORG filter and a health filter (All, Healthy, Warning or Error). The search matches the VPG name, ZORG and the site names.
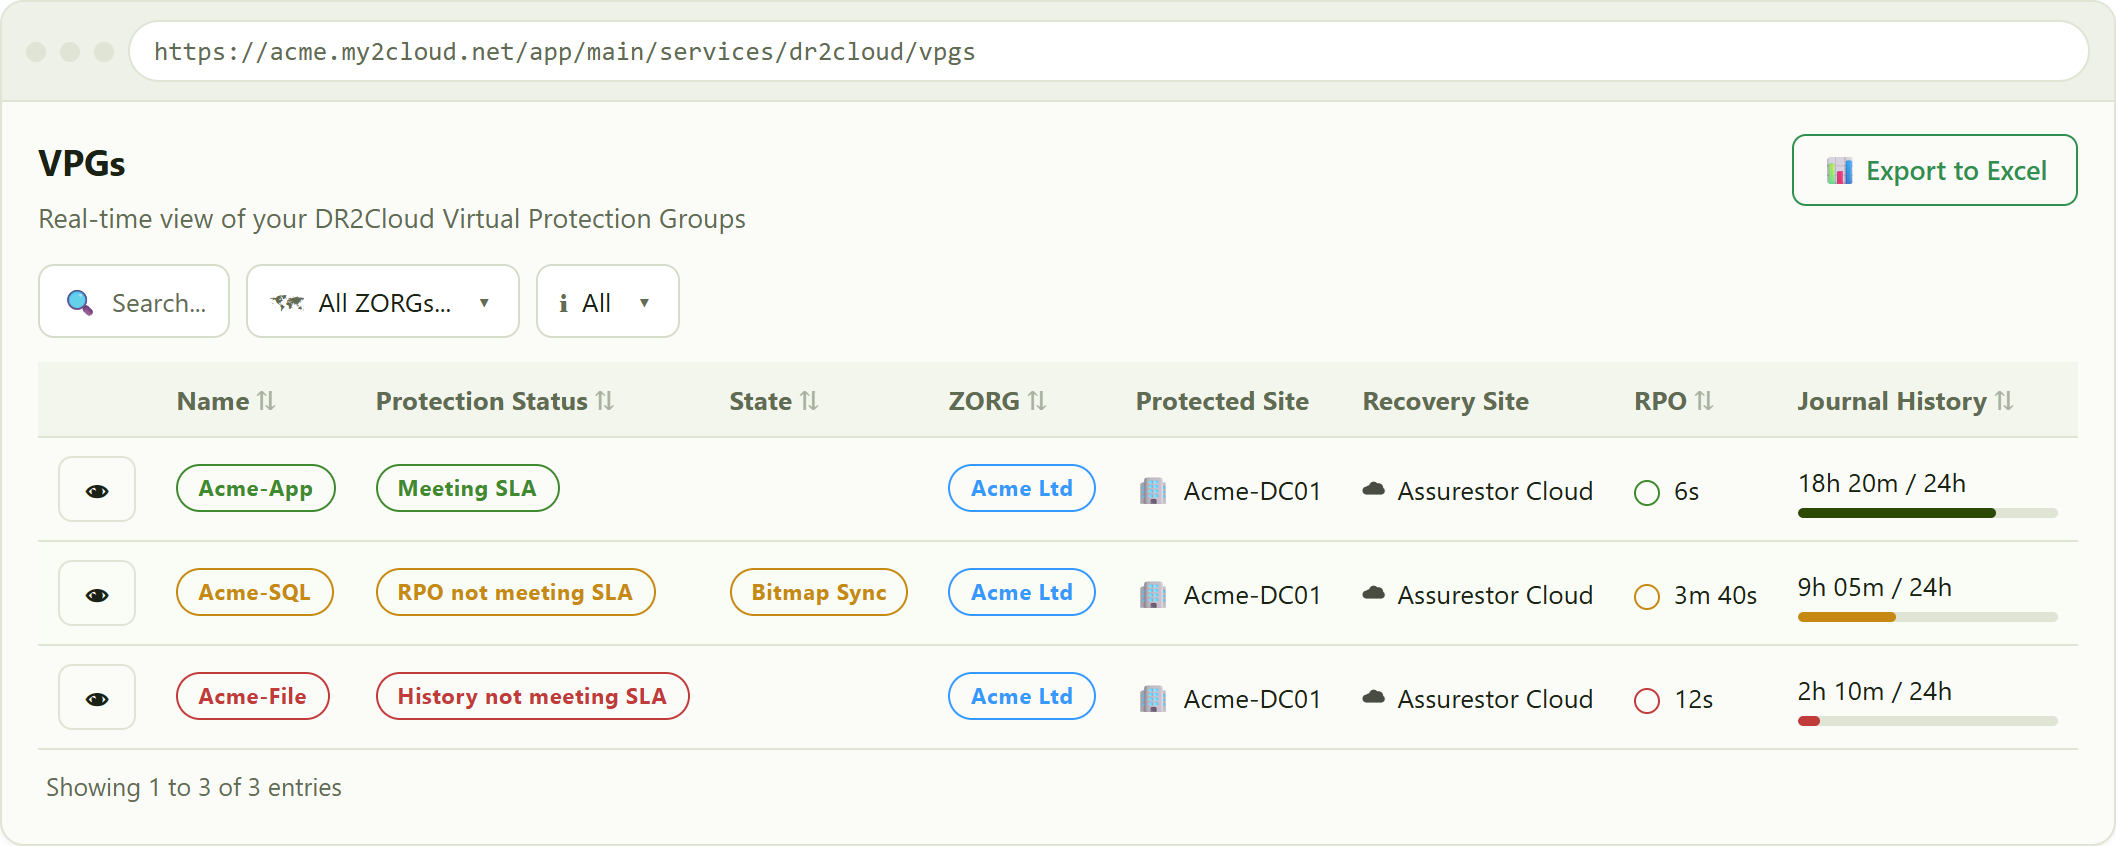
the VPGs list. The coloured dot on the RPO figure and the journal bar show at a glance how each group is tracking against its target.
What each column means
- Name - the VPG name, shown as a coloured pill: green when healthy, amber for a warning, red for a problem.
- Protection Status - the overall replication state in Zerto's own words, for example "Meeting SLA", "RPO not meeting SLA" or "History not meeting SLA".
- State - extra detail when something is happening, such as an initial sync. It is blank when there is nothing to report.
- ZORG - the Zerto organisation the VPG belongs to.
- Protected Site and Recovery Site - the "from" and "to" ends of replication, each with a small icon showing the platform.
- RPO - the current recovery point, with a colour dot: green when comfortably inside target, amber as it approaches, red when it is at or over target.
- Journal History - how far back you can recover, shown as actual / target with a small bar. The bar turns amber if the journal is shorter than its target.
Click the eye icon at the start of any row to open the full VPG Details pop-up for that group.
The VPG Details pop-up
The details pop-up opens with the VPG name and a status badge in its header, then a set of tabs. The first tab, VPG Details, is the summary you will look at most. Across the top are four figures - Actual RPO, History, Protected VMs and Attention (open alerts) - followed by a simple picture of replication flowing from the protected site to the recovery site, and two SLA cards for RPO and history.
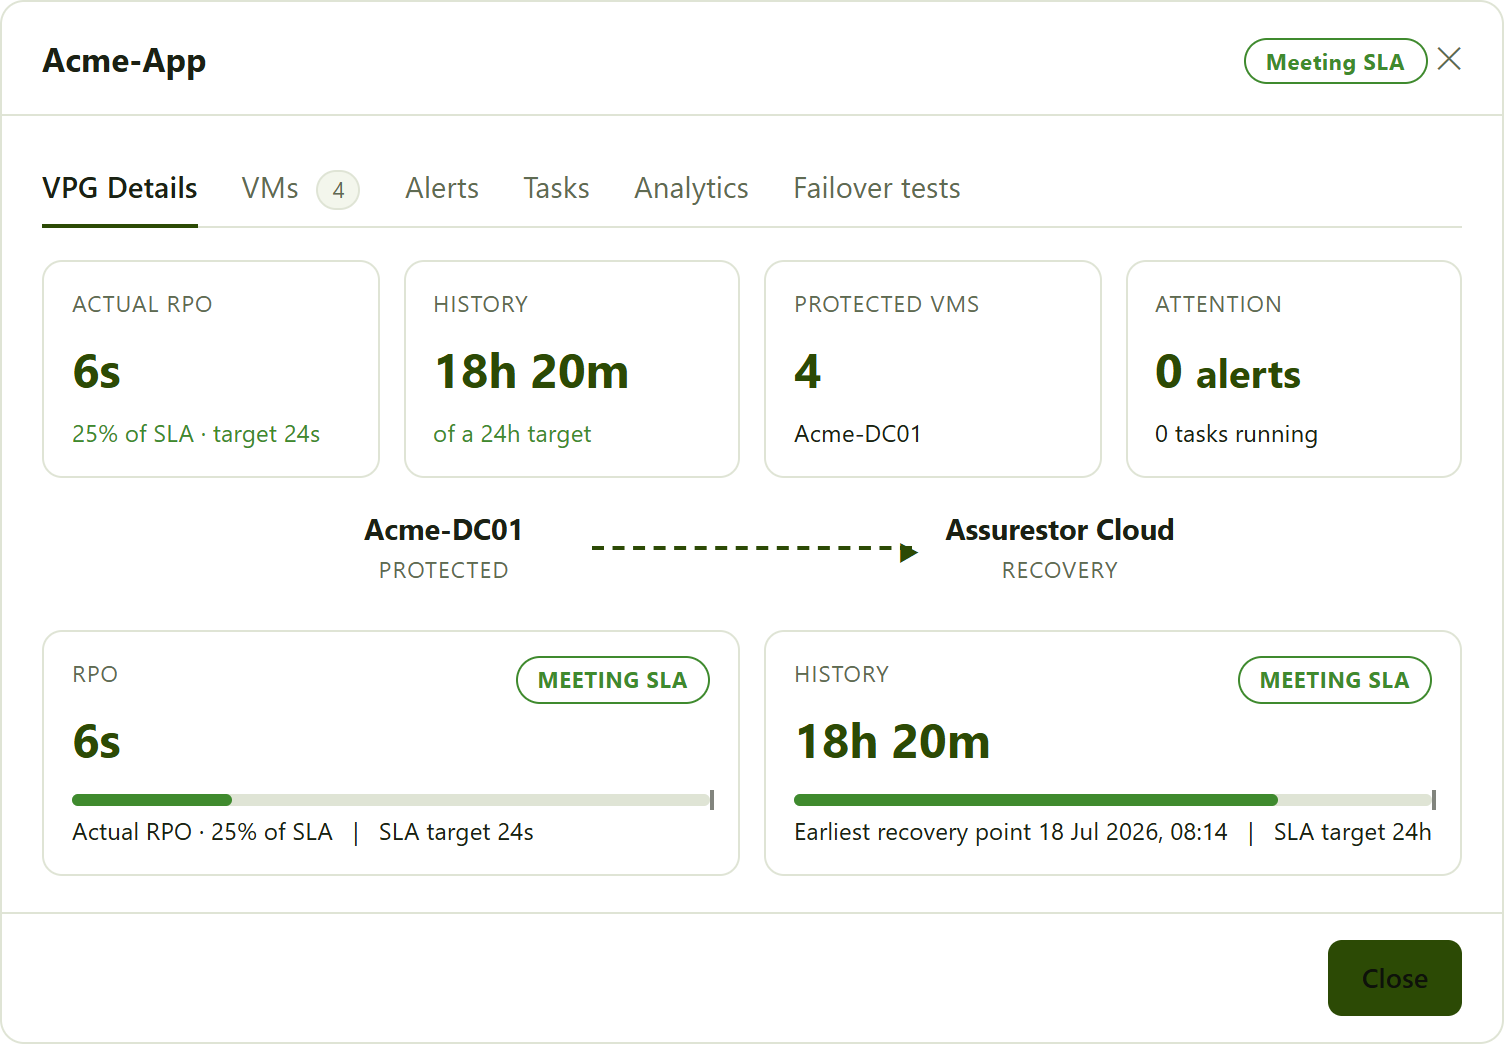
the VPG Details tab. The two SLA cards read actual-against-target; the small tick on each bar marks the SLA line.
Reading the RPO and History cards
Both SLA cards work the same way and are the easiest way to see whether a VPG is healthy:
- RPO - the big number is your current recovery point, for example "6 seconds behind". The bar fills up as you approach your target (the SLA), and the small tick marks where the target sits. A short, green bar is exactly what you want: it means only a few seconds of data would be at risk. As the figure climbs the card turns amber, then red once it reaches the target, and the header pill changes from Meeting SLA to RPO not meeting SLA.
- History - the big number is how far back you can currently recover, and the target is how far back you asked to be able to go (for example 24 hours). Here a fuller bar is the healthy state, because it means more recovery checkpoints are available. The card also shows the earliest recovery point - the oldest moment in time you could restore to right now.
In short. RPO answers "how much could I lose?" (you want it small), and journal history answers "how far back can I go?" (you want plenty of it). The pop-up shows both as a live figure next to your agreed target, so you never have to work out the maths yourself.
The other tabs
- VMs - the individual machines in the group, with their provisioned and used storage, journal usage and average performance (IOPS, throughput and WAN traffic).
- Alerts - any open Zerto alerts for this VPG, colour-coded by severity, each linking out to Zerto's own guidance.
- Tasks - operations in progress or recently run against the VPG, with a progress bar and who started them.
- Analytics - historical RPO, storage and network charts over a date range you choose (Today, Last 7 Days, This Month and so on).
- Failover tests - covered below; this tab only appears when the feature is enabled for your service.
The Storage view
The Storage view shows the datastores behind your DR2Cloud service. Start by choosing a site from the site picker; the view then shows a capacity chart at the top and, below it, a table of that site's datastores. You can also search by name and narrow to a single datastore.
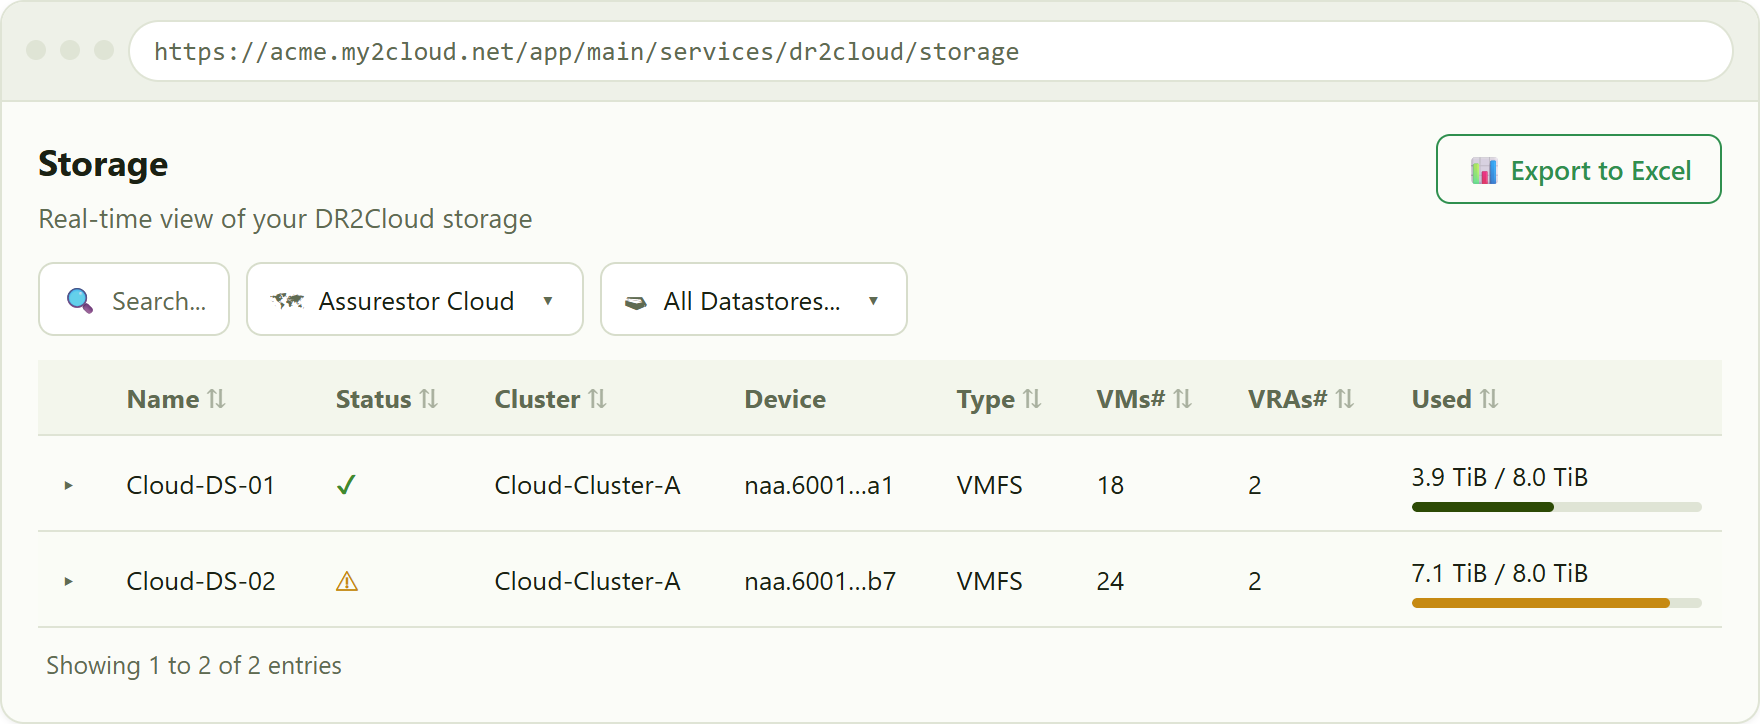
the Storage view for a chosen site. The Used column shows used-against-capacity, turning amber then red as a datastore fills up.
What the columns mean
- Name - the datastore name.
- Status - a health tick: green for normal, amber for a warning, red for an error.
- Cluster - the host cluster the datastore belongs to.
- Device - the underlying storage device(s).
- Type - the datastore type, for example VMFS.
- VMs# - how many virtual machines sit on the datastore.
- VRAs# - how many Zerto Virtual Replication Appliances are using it.
- Used - used space against total capacity, shown as a bar that turns amber as it fills and red when it is nearly full.
Click the arrow at the start of a datastore row to expand it and see its Related Volumes - the individual disks on that datastore, each with its used and provisioned size, the owning VM, the protected VM and the VPG it belongs to. Thin-provisioned volumes are flagged with a small Thin tag.
When a site is disconnected
Sites stay in the picker even when they are not currently reporting to Zerto, so you can always select them. If you pick a site that is disconnected, the storage table is replaced by a clear amber message instead of an empty grid, so you know the gap is a connection issue rather than a site with no storage.
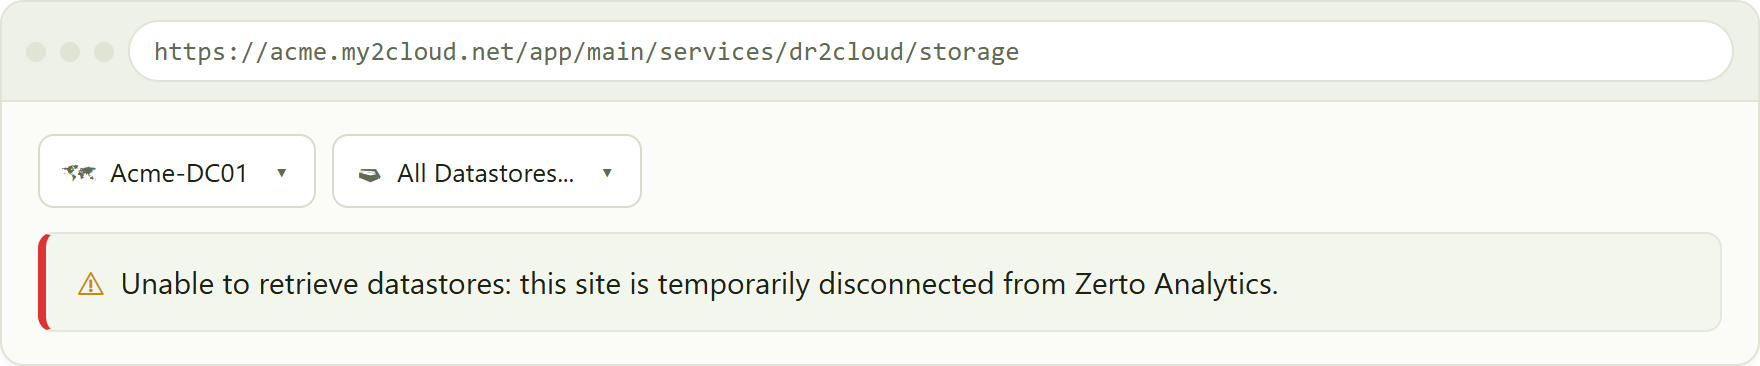
a disconnected site. A permanently disconnected site shows a similar message and can happen when the site uses its own licence key rather than the shared cloud licence.
The Failover tests view
Where it is enabled for your service, each VPG's details pop-up has a Failover tests tab. A failover test starts a temporary copy of your protected machines at the recovery site to prove they would come up cleanly, without touching your live environment. A small coloured dot on the tab tells you whether automated testing is switched on (green) or off (red) for that VPG.
At the top of the tab is an Enabled / Disabled toggle button. When testing is on, the view confirms the schedule - for example "Automated failover test scheduled for the 15th of the month at 02:00" - and lists the history of past tests below. When it is off, you see a short message explaining how to switch it on.
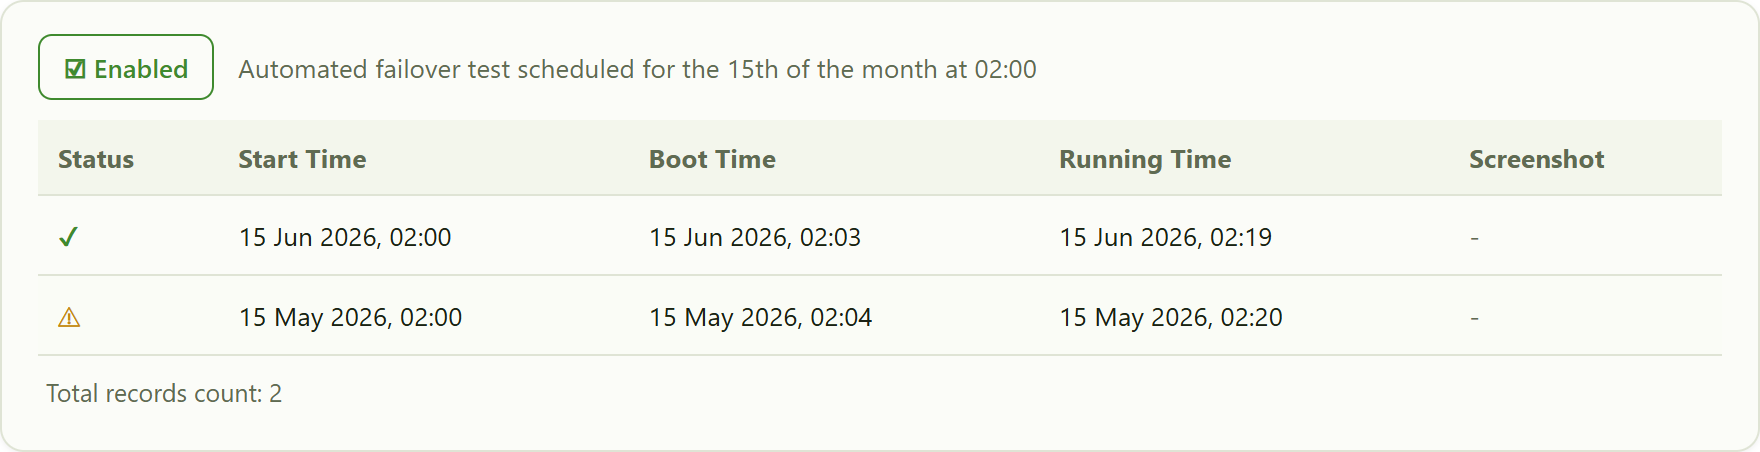
the Failover tests history. Each run shows a Status icon (success, warning or error), the start, boot and running times, and any captured screenshot.
The history table columns are:
- Status - an icon for the test result: a green tick for success, an amber triangle for a warning, a red cross for an error.
- Start Time - when the test began.
- Boot Time - when the recovered machines came up.
- Running Time - how long the test ran before it was cleaned up.
- Screenshot - a captured screenshot from the booted machine, where one is available.
If you do not see a Failover tests tab at all, automated testing is not part of your current DR2Cloud service. Speak to Assurestor if you would like it enabled.
Tips
- Because the VPGs list is sorted by RPO with the highest first, the groups needing attention are always at the top of the list.
- Use the health filter on the VPGs view to jump straight to anything in Warning or Error.
- On the Storage view, sort by Used (largest first) to spot the datastores filling up soonest.
- A red RPO or a short journal bar is not always a fault - a large change, a new VPG still syncing, or a brief network dip can push the figures up temporarily. Open the VPG and check the Alerts and Tasks tabs to see what is happening.
- Export to Excel on any DR2Cloud view downloads the list as you have it on screen, keeping your current filters and sort order.
Was this article helpful?
That’s Great!
Thank you for your feedback
Sorry! We couldn't be helpful
Thank you for your feedback
Feedback sent
We appreciate your effort and will try to fix the article