On the usage and analytics dashboards you choose the period the figures cover - this month, the last quarter, the last year, or any custom span. This guide shows how to open the Dashboard Filters window, pick a date range, and understand which widgets it affects.
Where to find it. The date range lives behind the Filter button in the top-right corner of a dashboard's header, for example on My Dashboard and the usage/analytics dashboards underDashboardandAnalyticsin the main menu. Live service dashboards show current data and do not have a date range.
1. Open the filters
Look at the top-right of the dashboard header. Where a dashboard supports filtering you will see a Filter button. Any filters already applied are shown to its left as rounded pills, including the current date range, so you can see the active period at a glance without opening anything.

the Filter button in the dashboard header, with the currently applied date range shown as a pill.
Click Filter to open the Dashboard Filters window.
2. Choose a date range
The Dashboard Filters window lists every filter the dashboard offers. The Date Range section is at the top. You have two ways to set it:
- Quick presets - click one of the buttons below the field: This Month, Last Month, Last 3 Months or Last 12 Months. The range updates instantly.
- Custom range - click in the date field to open the calendar, click your start date, then your end date. The two dates fill in as a "from - to" range.
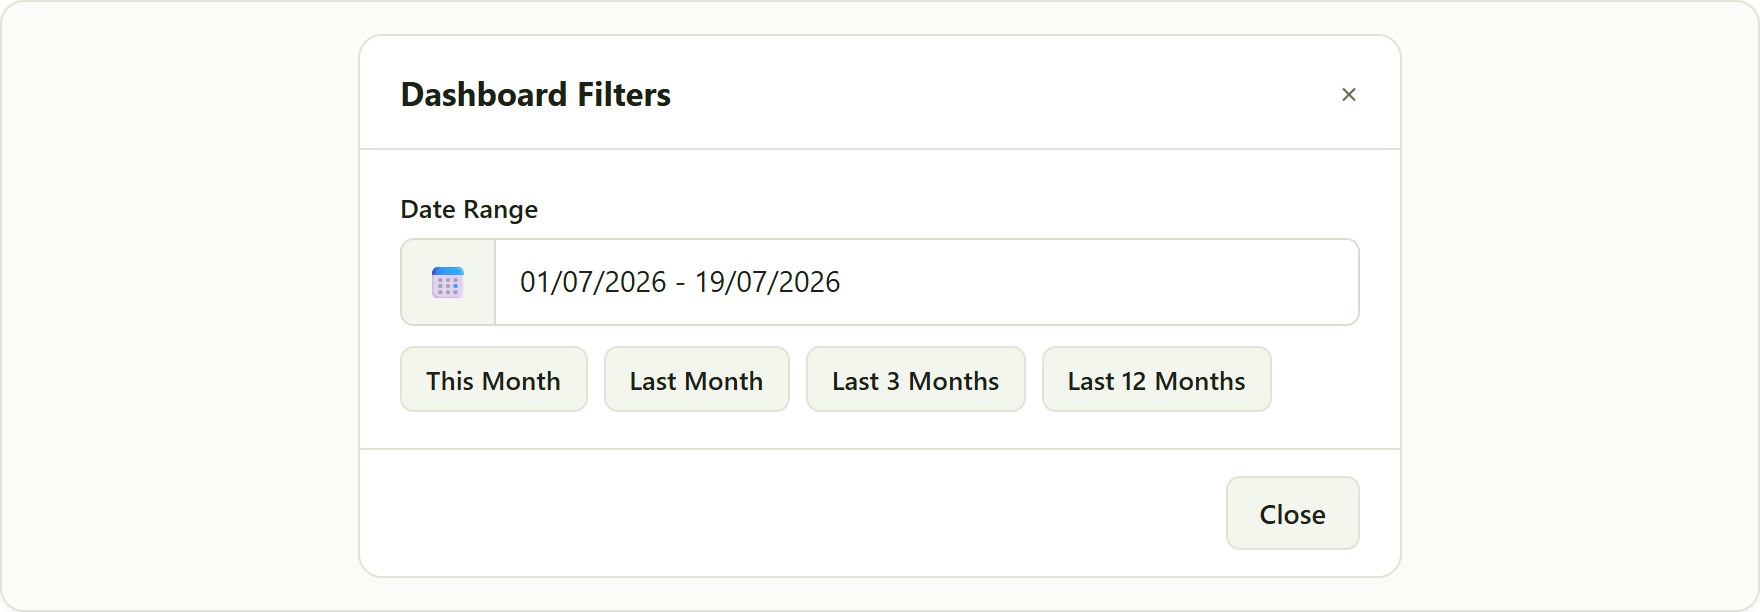
the Dashboard Filters window, showing the Date Range field and the quick preset buttons.
Dates are shown UK style. Ranges appear asdd/mm/yyyy, for example01/07/2026for 1 July 2026, and are worked out in your local time. When you first open a dashboard the range defaults to the current month, from the 1st to today.
3. Apply and close
There is no separate "apply" step. As soon as you pick a preset or complete a custom range, the analytics widgets on the page refresh to match, and the date pill in the header updates. When you are done, click Close (or the ×). If the dashboard offers other filters, such as an account, company or organisation picker, you can set those in the same window before closing.
4. How the range affects your widgets
The date range drives the Analytics widgets - the charts, trend lines and month-on-month comparison tiles that look back over time. Widen the range and a chart plots more history; narrow it and it zooms in on a shorter period. The comparison figures (for example "up 4% on the previous period") are also measured against the range you have chosen.

analytics widgets redraw to cover the selected range, and their comparison deltas are measured against it.
Live widgets are not affected. Widgets and dashboards labelled Live always show the latest figures we hold, no matter what date range is set. So on a mixed dashboard the Live account and storage counts stay put while only the Analytics charts respond to the range. The dedicated live service dashboards have no date range at all.
Tips
- The range you set is remembered for the current visit. Reopening a dashboard starts fresh on the current month.
- My2Cloud keeps up to twelve months of history, so Last 12 Months is the widest built-in view. A custom range reaching further back simply shows data from as far as the history goes.
- For the longest trends, pick Last 12 Months; to check the current billing month, This Month is usually what you want.
Troubleshooting
- No Filter button - that dashboard has no filters. Live service dashboards show current data only and have no date range.
- A chart looks empty - the selected range may fall in a period with no collected data, or before the service was enabled for you. Try Last 3 Months or Last 12 Months.
- A number did not change when I changed the range - that widget is a Live widget and always shows current figures. Only Analytics widgets follow the date range.
- Dates look the wrong way round - dates are UK format, day first:
01/07/2026is 1 July, not 7 January.
Was this article helpful?
That’s Great!
Thank you for your feedback
Sorry! We couldn't be helpful
Thank you for your feedback
Feedback sent
We appreciate your effort and will try to fix the article